
Ice Rink Shade
The Chevy Chase Country Club was considering a partial sun covering for their outdoor ice rink. At the personal request of a ckub employee, I created a simulation of how much of the rink would be shaded over the course of the day at different times of year.
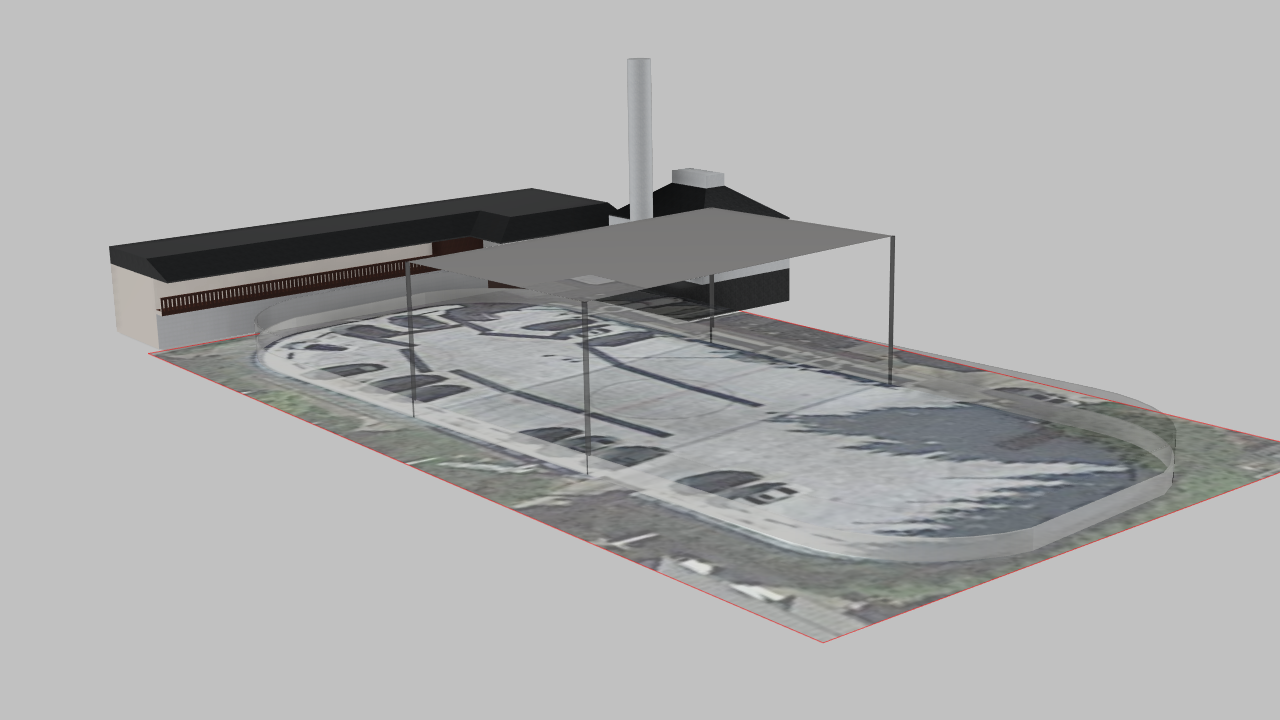
The simulation calculates what portion of the rink is shaded based on the geometry of the rink cover and the position of the sun for every minute from 9am to 4pm, when the sun is the most intense.
It then outputs a graph showing how the shaded region moves vertically, and illustrates how the covering shades more of the rink during months when the sun is low in the sky.
It also outputs a heat map, showing the distribution of total minutes of shade across the rink.
Using graphics for every day of the ice rink’s season, from October to March, I created time lapses, showing how the effectiveness of the shade covering will change over time.
These graphics were used to help the club determine the position and size of the shade covering, and better define a set of requirements for the contractor building the covering, which will be installed next summer.
The code is on Github.